
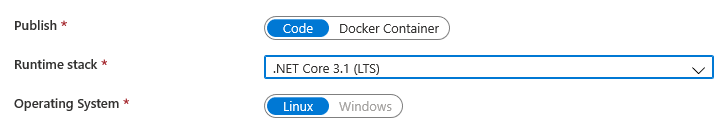
When you create a new Azure Web App for a new .NET Core application, you’ll notice that you need to select the appropriate Runtime stack and Operating System.
You’ll probably also notice that if you select “.NET Core 3.1 (LTS)” for the Runtime stack, the Operating System can be “Linux” or “Windows”.
However, if you select “ASP.NET V4.7” for the Runtime stack, the Operating System is “Windows”, and cannot be changed to Linux.
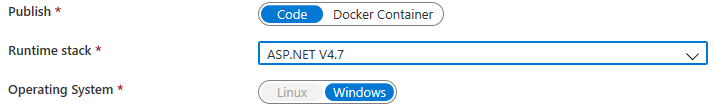
This begs the question: What should you deploy your new .NET Core application to – Linux or Windows?
To answer that question, let’s run a load test! This article will use the virtual machine for Apache JMeter created in another article.
Deploy the application
As mentioned in another post, you will want to make sure your Azure resources are in the same Region/Location (Azure data center).
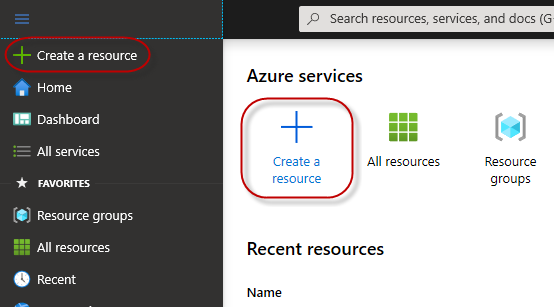
As with all Azure resources, you’ll begin creating a new resource by selecting +Create a resource from the Azure portal dashboard, or selecting the Create a resource hamburger menu item.
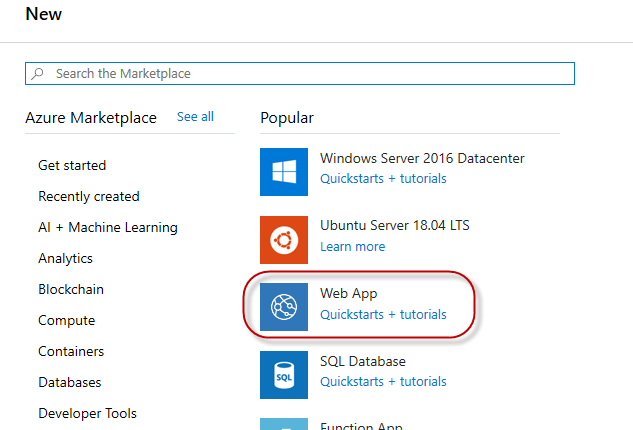
Select Web App from the New resource blade.
Create the Azure Web App for Linux
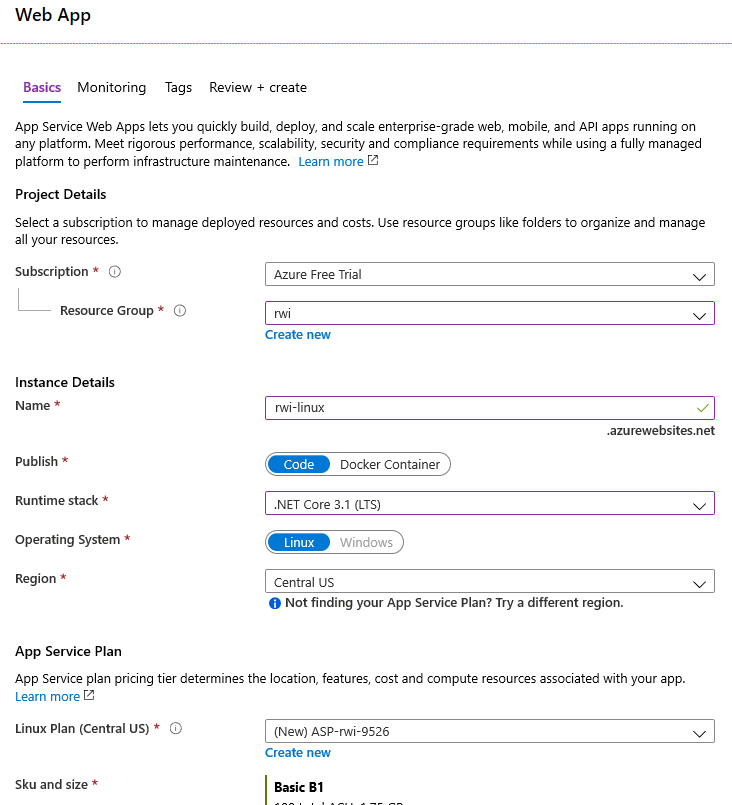
On the Create Web App blade, select the appropriate Resource Group, specify a meaningful Name, select the “.NET Core 3.1 (LTS)” Runtime stack, and choose the same Region (location or data center) as your Resource Group.
You can also select an inexpensive Sku and size, while you are standing the web app up. You’ll want to scale the resource up from a “Dev/Test” level to a higher Production level before the load test.
Also note that if you have a Linux Web App in a resource group, you cannot add a Windows Web App to that resource group.
Click the Next: Monitoring > button, and note that Enable Application Insights is set to “No”. It is not supported for the Linux OS. Click the Review + create button, then click the Create button.
Create the Azure Web App for Windows
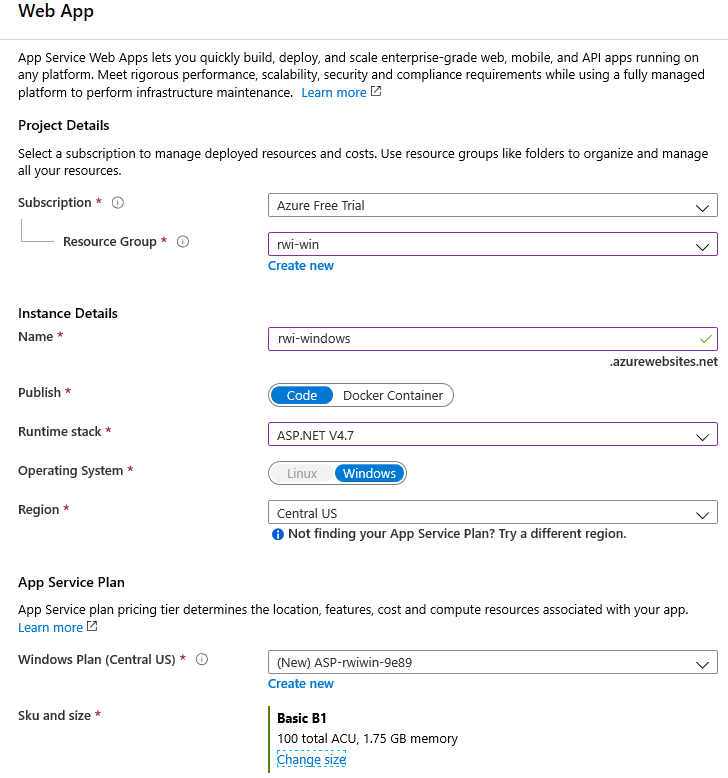
On the Create Web App blade, select the appropriate Resource Group, specify a meaningful Name, select the “ASP.NET V4.7” Runtime stack, and choose the same Region (location or data center) as your Resource Group.
Like the Linux web app, you can also select an inexpensive Sku and size, while you are standing the web app up. But you can already see the price difference in similar machine builds. The B1 Windows instance is $32.12/mo, while the B1 Linux instance is $13.14/mo.
Again, note that the resource group cannot be the same as one that contains a Linux web app.
Click the Next: Monitoring > button, and you’ll see that Enable Application Insights is set to “Yes”. For your load test, you can choose to enable this feature, but you do not have comparable monitoring for the Linux web app. Click the Review + create button, then click the Create button.
Web App configuration
Whether you are using the Real World Impact project, or deploying your own, you’ll need to add the custom configuration values.
If you were testing locally, you’ll notice the appsettings.json file as this:
{
  ...
  "ConnectionStrings": {
    "AzureStorage": "***USER-SECRET/AZURE-VAULT***",
    "RedisCache": "***USER-SECRET/AZURE-VAULT***"
  },
  "Redis": {
    "databaseIndex": "0",
    "cacheDuration": "300"
  },
  ...
}
But you will need to use your own user settings with custom values, for your own storage account (from the Solution Explorer, right-click the RWI.WebApi project, and select Manage User Secrets), and these values supersede those in the appsettings.json file.
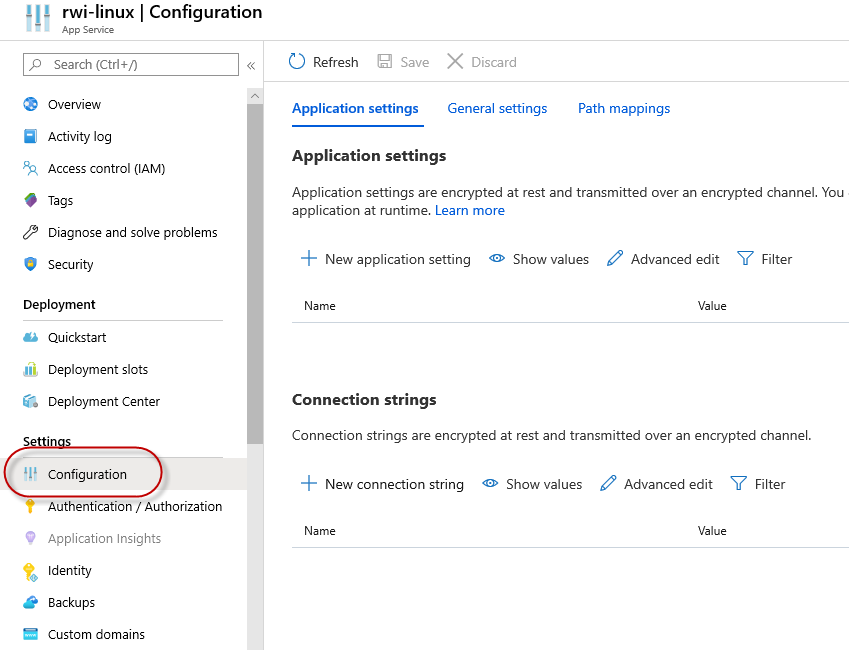
When you deploy the web app, you need to get these values into the web app Configuration. Go to the web app resource, then click the Configuration menu option.
The nested JSON structure needs to be flattened for the name/value pairs.
For example, take this JSON key:
{
...
"ConnectionStrings": {
...
"AzureStorage": "DefaultEndpointsProtocol=https;AccountName=...",
...
},
...
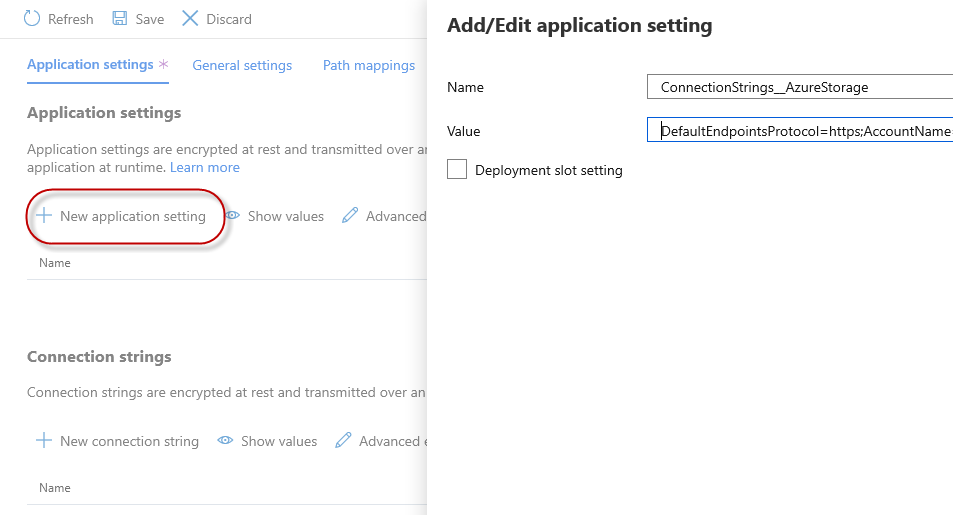
}For a Windows web app, the Name will be “ConnectionStrings:AzureStorage”.
For a Linux web app, the Name will be “ConnectionStrings__AzureStorage”. Note that the colon (“:”) is replaced with double underscore (“__”).
To add the application configuration settings, click + New application setting, specify the Name and Value, then click the OK button. When finished entering all settings, click the Save button, and then click the Continue button to confirm the changes.
For the Linux web app, add an additional application setting with the Name “WEBSITE_WEBDEPLOY_USE_SCM” and the Value “false”. This will allow you to use Visual Studio to web deploy to that Linux web app. (This does not need to be done for the Windows web app.)
Deploy the Web App
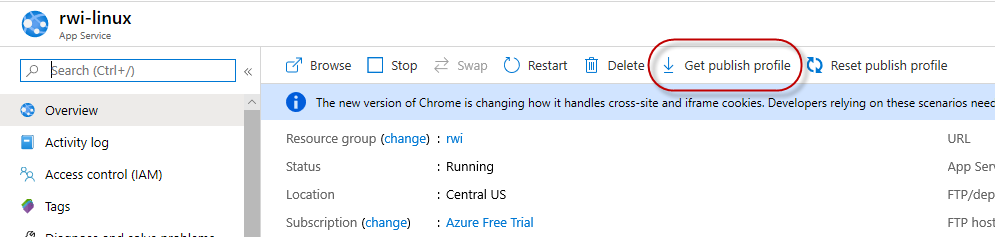
From each web app Overview, click Get publish profile.
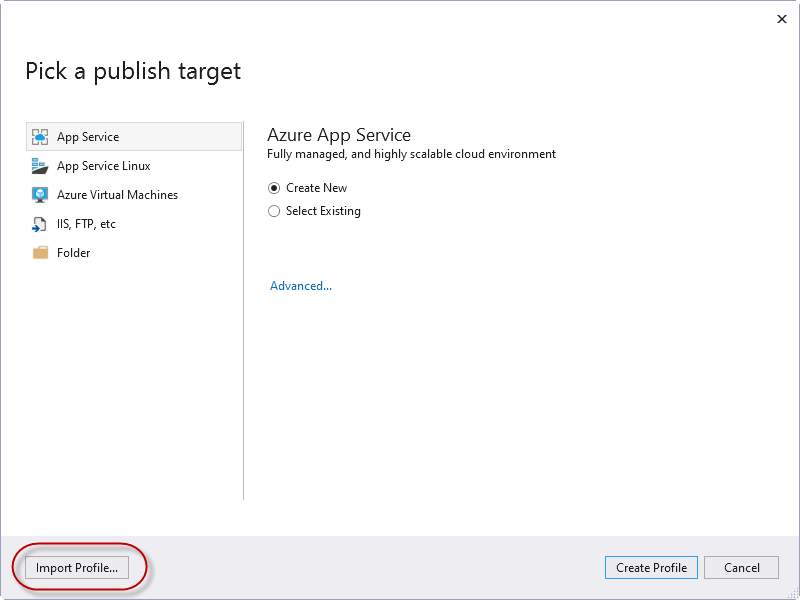
From Visual Studio, right-click the RWI.WebApi project, and select Publish. If you do not have any publish targets configured, you will be prompted to create or select an app service, or to import a publish profile. Click Import Profile. Select the downloaded publish profile for each web app.
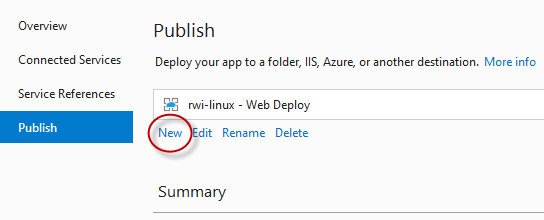
If you do have already have publish profiles configured, you can add a new profile, then import the downloaded publish profile.
Once the publish profile is created, click the Publish button for the desired Web Deploy profile, and the web app will be deployed!
Create the load test
When you execute a load test to observe performance of the hosting tier, you need to select comparable performance levels (scale or size) for the Linux and Windows operating systems. In fact, you’ll even want to run the test for each size you could conceivably utilize, for scenarios like large memory operations that perform better when more CPU or RAM is available. In this particular case, the load test will use the Basic/B1 size.
The load test itself should hit a variety of things that impact performance. For the Real World Impact web API, there is a Cryptography controller that does strictly CPU computational operations, while the Basic Net Op controller will retrieve a CSV file from Azure storage, and then deserialize the records into objects. This load test will use a 50/50 mix of each at the same time.
NOTE: Be sure your load tests are identical, as not to skew or bias your results!
Create the Apache JMeter test plans
Launch the Apache JMeter UI (/bin/jmeter.bat), to begin with a new test. You can also open a recent test plan (.jmx file). By the time the test plan is completed, you will have thread groups for each endpoint you will test, and will have defined the HTTP request for each. You’ll also have at least one listener defined.
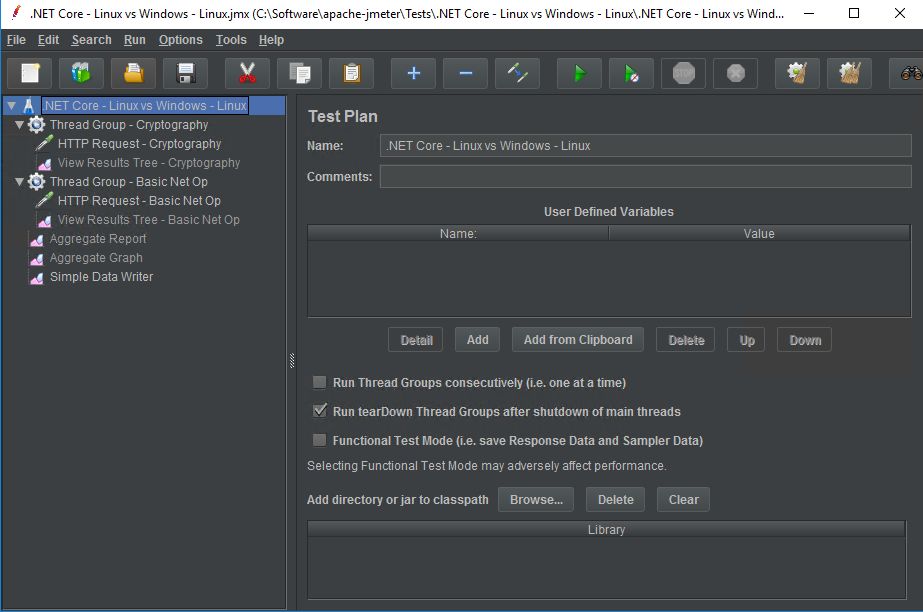
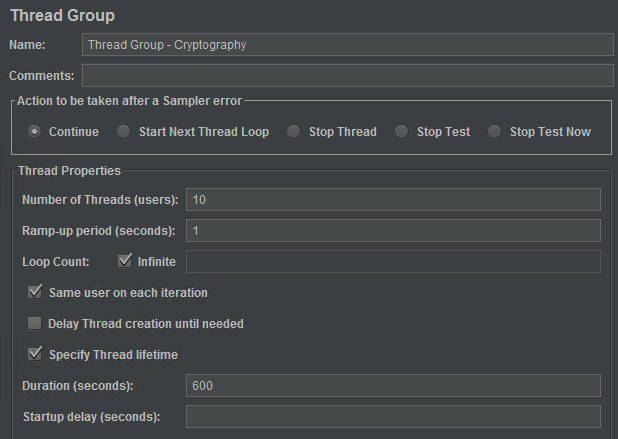
Give your test plan a meaningful Name. Right-click the test plan in the left-hand panel, and add a new Thread Group. Give that thread group a meaningful Name, and set the Number of Threads (users).
NOTE: In this example, there will be two thread groups, hitting the two RWI endpoints. Since the target is a 50/50 split for the load traffic, make sure the number of threads is the same for each defined thread group.
Check Infinite for the Loop Count, since the plan is to re-run the HTTP request until the entire test plan completes. Check Specify Thread lifetime, and set the Duration (seconds).
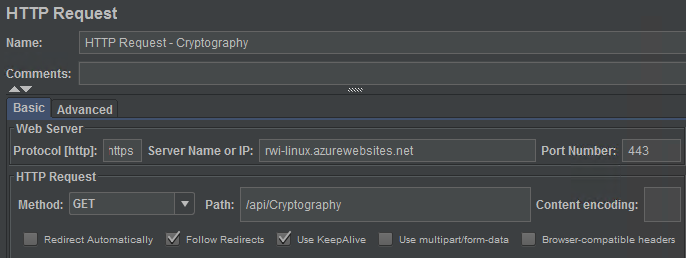
Right-click the thread group, and select Add -> Sampler -> HTTP Request. Specify the Protocol [http] as “http” or “https”, the Server Name or IP of the web application being tested, the Port Number if non-standard, the Method, and the endpoint Path.
To test the request, right-click the thread group, and select Add -> Listener -> View Results Tree. Click the Play button, and you can see the requests being issued in the listener.
NOTE: It is recommended that you disable any UI listeners in the test plan prior to running the load test. You can right-click each, and select Disable.
Once both thread groups have been created, you need to add the listener that will be used for capturing results. Right-click the test plan, and select Add -> Listener -> Simple Data Writer.
Save the test plan to a .jmx file. To create the next test plan, simply Save As a new .jmx file, then modify the server for each HTTP request, and save again. Exit the JMeter UI before testing.
Execute the test plans
From the command line, change to the JMeter bin directory, then execute JMeter without the UI:
jmeter.bat -n -t "{test-plan-file-path}.jmx" -l "{results-directory}\{results-file-name}.jtl"{test-plan-file-path}.jmx is the full path and file name of the JMeter test plan. {results-directory} is the a directory you’ve created to store the results, while the {results-file-name}.jtl is a unique file name that will be created by the test plan execution.
JMeter will periodically write updates to the console while the test runs. After all thread groups have completed execution, you’ll see the completion message. You can now execute the other test plan.
Compile the results
Launch the JMeter UI again, and in the menu, select Tools -> Generate HTML report.
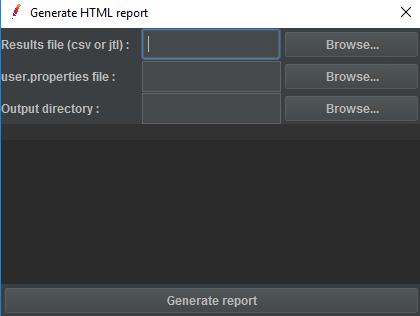
Browse to the Results file you just created, the user.properties file in the JMeter bin directory, and an empty Output directory for the report to be created at.
Results – Linux or Windows?
When you analyze load test results, you will typically ask:
- What was the throughput, or attempts per second?
- What was the average response time?
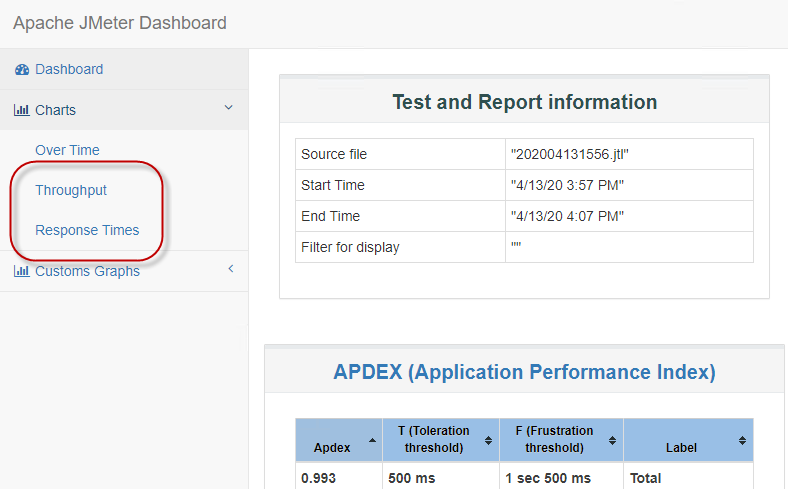
These questions are answered very clearly in the generated JMeter report. Navigate to the output directory for the generated HTTP report.
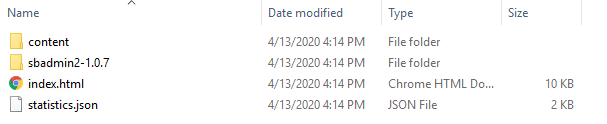
Launch index.html in a browser, and you’ll see all the statistics and reporting.
This example compares the Throughput and Response Times reports.
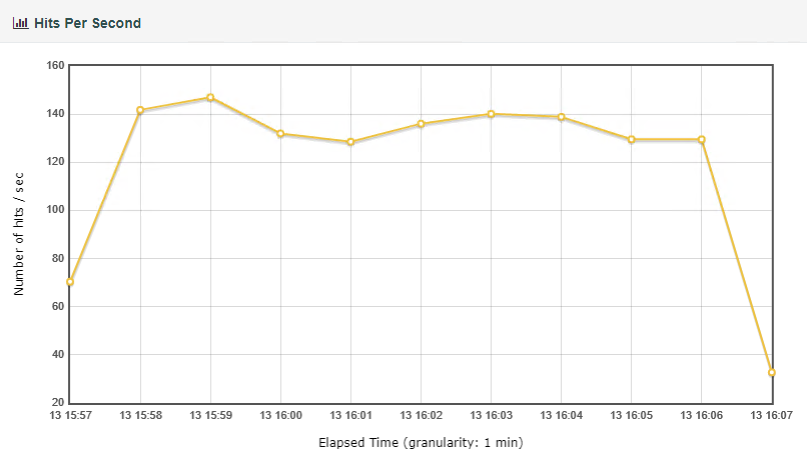
Performance on Linux
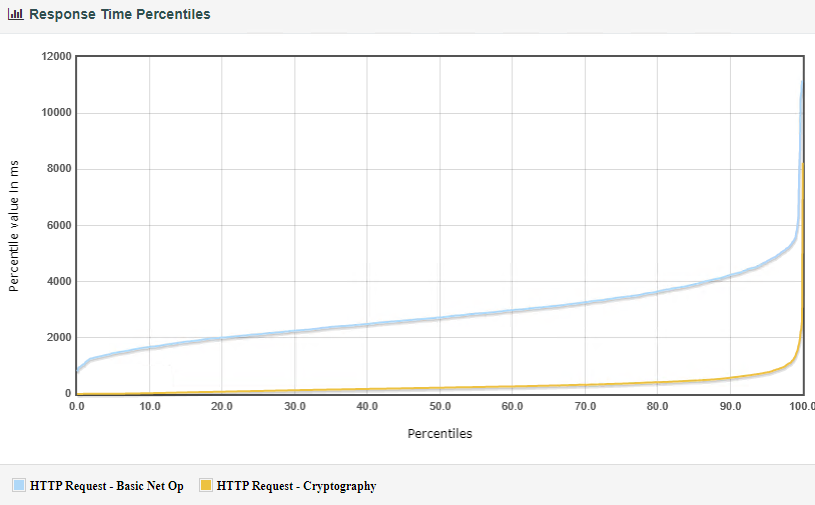
Throughput:
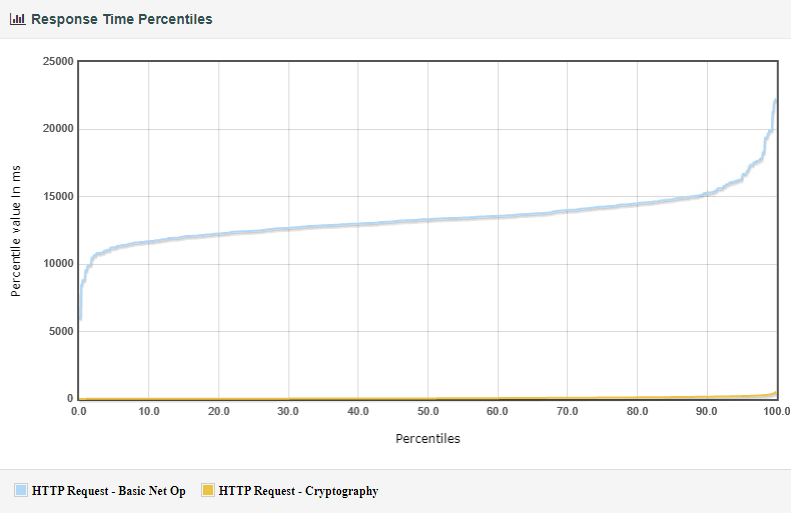
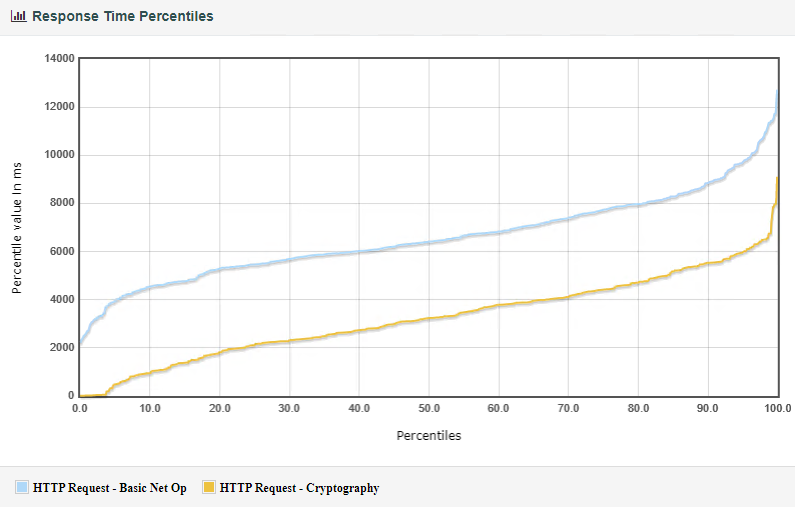
Response Times:
Performance on Windows
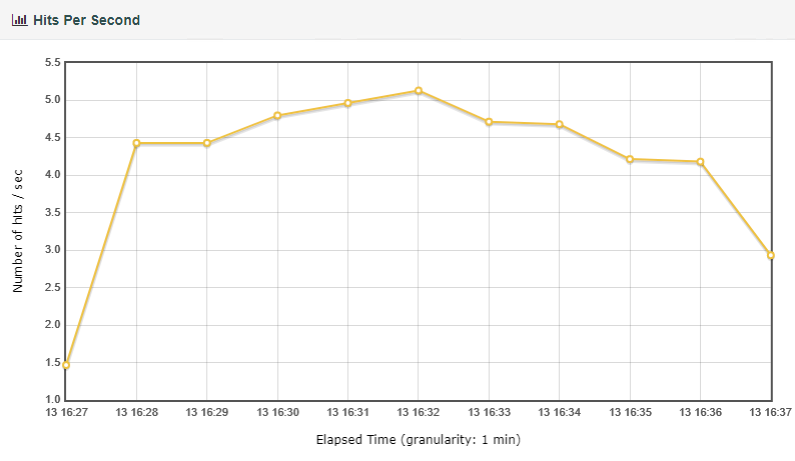
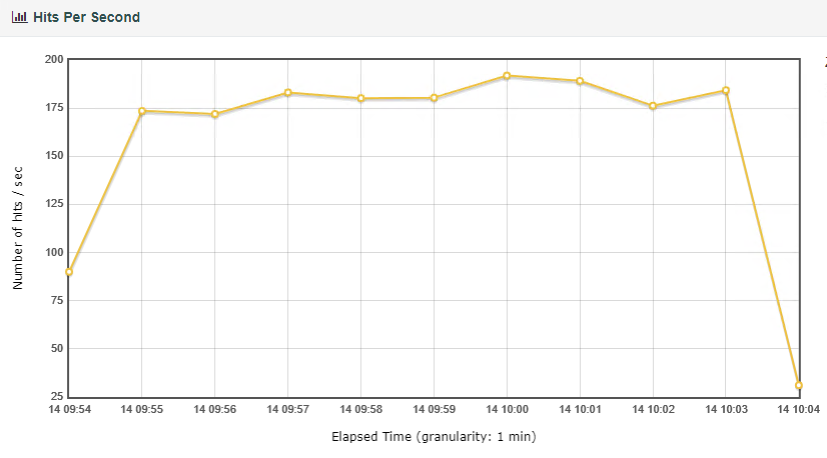
Throughput:
Response Times:
What do the results mean?
Based on throughput, the Linux OS web API was able to sustain over 120 requests per second, while the Windows OS web API struggled to hit 5 requests/sec.
The response times tell an interesting story. The Basic Net Op endpoint forces these smaller instances to repeatedly download and process a >1Mb file for each request, which results in the higher response time. The Windows instance was able to handle the processing more efficiently, but struggled with the strictly computational activity.
Since there is uncertainty in the results, the next logical step is to increase the scale of each instance, and try again.
Performance comparison (S2)
If you scale the web apps to S2, which is a Production-level tier with double the Azure Compute Units (“ACU”) and RAM, you can re-run the same tests.
Throughput on Linux:
Response Times on Linux:

Throughput on Windows:

Response Times on Windows:
The throughput on the Linux instance did increase, but the number of hits was not as significant as the increase on the Windows instance. This could be explained by the Basic Net Op response time decreasing, allowing the Linux instance to handle more of those requests, but decreasing the number of Cryptography requests. Still, the Windows instance was better able to handle the Basic Net Op requests.
Takeaways & Lessons Learned
This scenario is a perfect example of challenging assumptions, and the need to test and re-test. Most people might assume at first that a Linux instance would win a performance comparison in all metrics, but that was not true (look at you, Windows!).
If sheer throughput is your metric of choice, or if operational performance is a better indicator, you have the ability to find the best solution with load testing.
When you can break down your own application logic into testable endpoints, you can determine what platform better meets your expectations and requirements. You can also further refine your tests and user load, by altering the balance – for example, changing to 70/30 instead of 50/50.
Pingback: Setting up an Azure VM for Apache JMeter – Collabroscape