
“Prove it.”
How many times did you say or hear that as a kid? How often do you hear it these days?
As software engineers, we love theorizing about “optimal solutions” and how X is so much better than Y. Oh, yeah? Prove it. This is where load testing comes into play.
Let’s face it: load testing is not sexy or fun. But do you know what silences critics, or that nagging doubt? Solid numbers. And do you know what feels really, really good? Actually optimizing a solution and actually saving money on infrastructure/hosting costs.
While most people tout the benefits of load testing for “surge” traffic, it’s an excellent way of A/B testing or proof-of-concept implementations, like:
- Synchronous code vs async/await
- .NET vs .NET Core
- Scale up vs scale out
- Distributed caching
But first, some background
Visual Studio had an amazing suite of web & load test tools baked right in. One of the most powerful was cloud load testing, which allowed you to spin up an Azure VM instance, execute a series of tests, and capture the numbers.
The beauty here was that you weren’t running a series of tests locally, that could be skewed by the YouTube videos you’re watching while you wait for the test to complete. You had an externally-hosted instance imitating web users, and if the instance and the website being tested were in the same Azure data center & resource group, virtually no latency. What’s more, you could do the same load tests from Azure DevOps.
Unfortunately, lack of adoption forced Microsoft to deprecate those tools.
Lucky for us, though, Apache JMeter is something we can use. And there is plenty of documentation on how to set it up and get your tests running.
So let’s get started, and configure an Azure virtual machine for Apache JMeter. You’ll be able to turn it on when you need to run some tests, then shut it down when you don’t currently need it (thereby saving some money, too).
Setting up your Azure environment
As mentioned earlier, you can reduce latency by keeping your load test VM in the same data center as your website. With Azure, these are referred to as Locations or Regions.
Create the resource group
Your Azure VM will require a storage account, if you are adding additional disk drives, and both the VM and storage account will need to be in the same location, and should be in the same resource group.
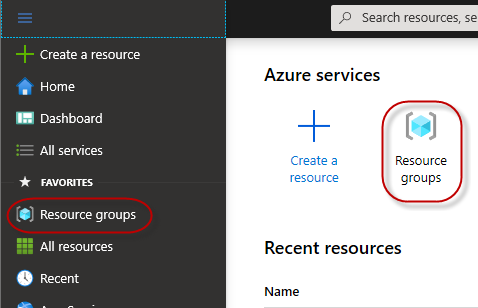
From the Azure Portal dashboard (https://portal.azure.com/#home), select the Resource groups button under Azure services, or click the hamburger menu, and select Resource groups.
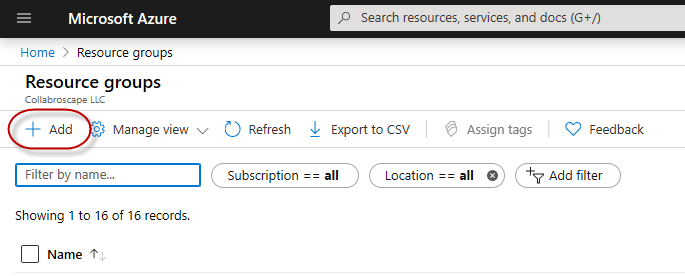
On the Resource groups blade, click +Add.
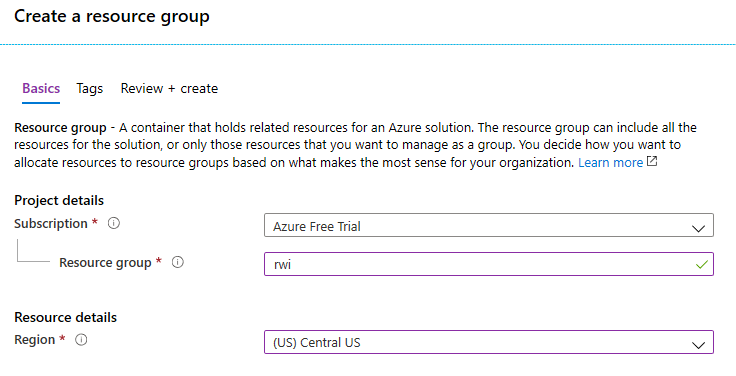
On the Create a resource group blade, be sure to specify a meaningful Resource group name, and select the same Region (location or data center) in which you’ll have your website to test.
Awesome! Once the resource group is created, it can be selected when you add new Azure resources.
Create a storage account
Before you create the VM, you can create the storage account for any additional disk drives you’ll create. If you aren’t utilizing additional drives, jump down to Create the virtual machine.
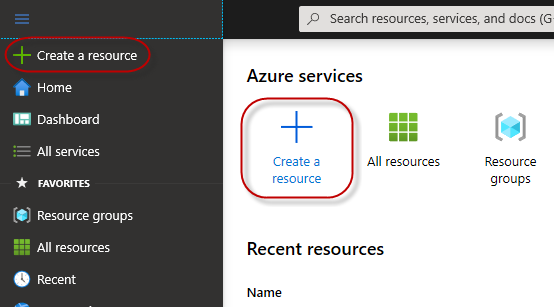
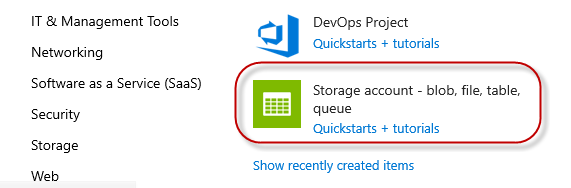
From the Azure Portal dashboard, select the +Create a resource button, or click the hamburger menu, and click Create a resource.
On the New blade, search for “storage”, or click the Storage account – blob, file, table, queue button.
On the Create storage account blade, select the Resource group you created earlier, provide a meaningful Storage account name, and select the same Location (region) you will use for your VM and website. You should also select the Premium Performance, since this storage account will back the virtual machine’s file system.
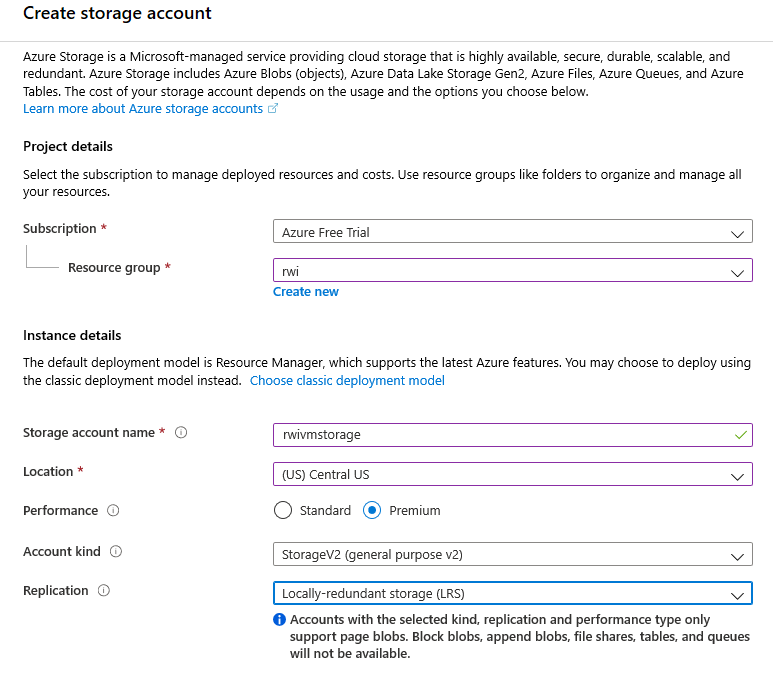
Click the Review + create button, and then click the Create button to finish creating the storage account.
Create the virtual machine
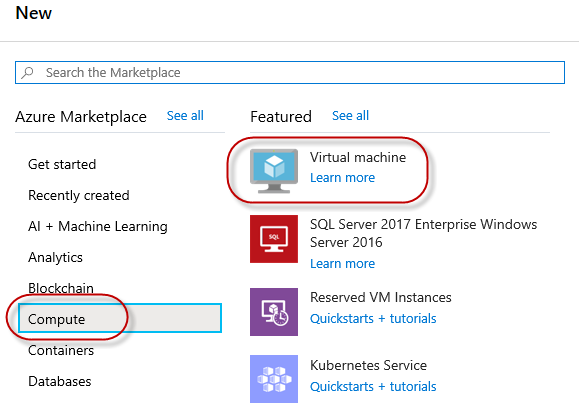
Now you have everything ready to create the VM. From the Azure Portal dashboard, select the +Create a resource button, or click the hamburger menu, and click Create a resource.
Select the Compute option, then click Virtual machine.
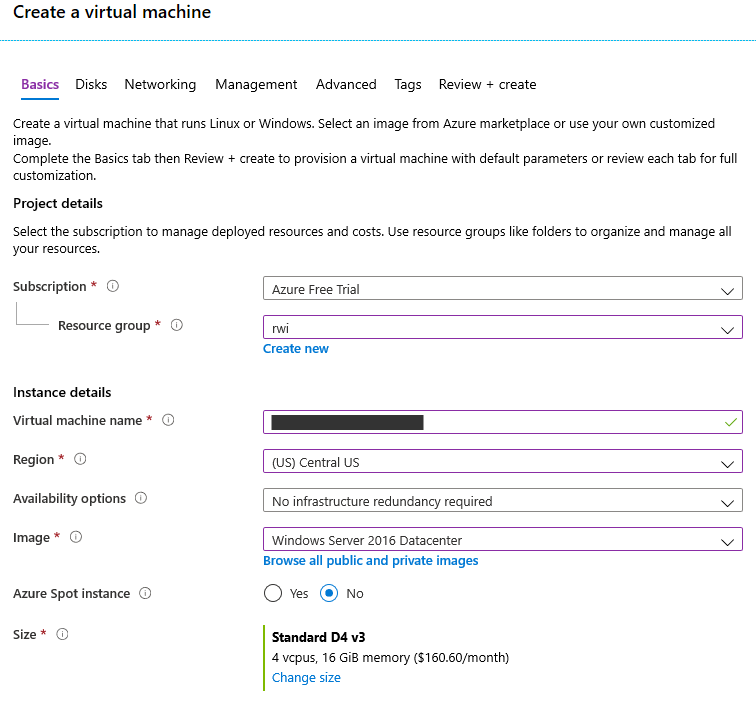
On the Create a virtual machine blade, select the Resource group you created earlier, provide a meaningful Virtual machine name, and select the same Region (location) you will used for your storage account. You also need to select the Image you are most comfortable with, and an appropriate Size.
NOTE: According to other tutorials, JMeter should have 16Gb RAM and at least 4 cores, since the multi-threaded application is how the load tests are executed so efficiently.
After you specify the Administrator account, and allow RDP (3389) for the Inbound port rules, click the Next : Disks > button.
If you are optimizing the VM, here is where you would add a new data disk drive. For this example, though, we will rely on the OS disk. Click the Next : Networking > button.
You can add the VM to an existing Azure virtual network (“vnet”), or it will create a new one by default. Verify the RDP (3389) inbound port is selected, and click the Next: Management > button.
On the Management tab, it is a really good idea to configure the Auto-shutdown rules, especially if you are creating a VM with a pricier size.

Click the Review + create button, then click the Create button to finish creating the virtual machine.
If you’ve enabled the Auto-shutdown, you will get an email prior to the configured shutdown time.
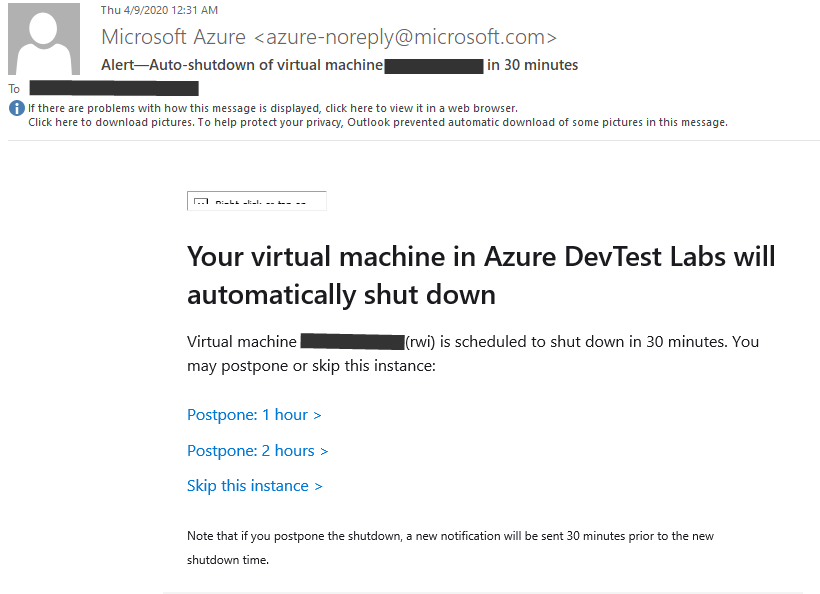
Just be sure to Start the VM again before you need it!
Setting up Apache JMeter
Once the virtual machine is created, you’ll need to connect to it, and set up the prerequisites before you can install & configure Apache JMeter.
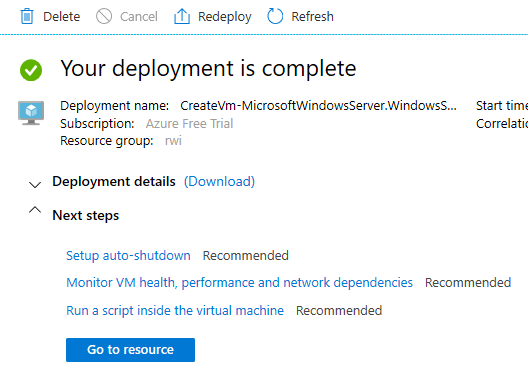
If you did not navigate away as the VM was being created, you’ll see the Your deployment is complete blade. Click the Go to resource button.
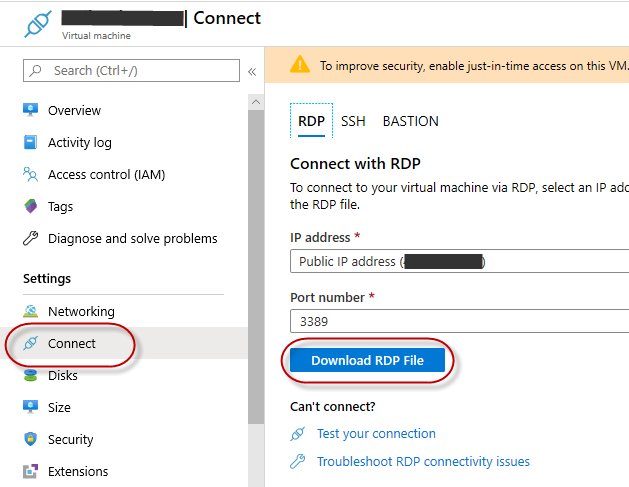
To RDP into the VM, you can download the RDP file by clicking the Connect button (under Settings on the left-hand side), then click the Download RDP File button.
When entering credentials, you’ll need to specify the username as a local account. For example, if your administrator username is “myadmin”:
.\myadminNow that you are connected, you can install what you need:
- Any browser but IE
- Java 8
- Apache JMeter
Fun fact: Internet Explorer is the most popular browser in the world for installing other browsers.
Download & install Java 8 JDK
Certain features of Apache JMeter depend on the JDK, rather than the JRE. You can find the downloads at: https://www.oracle.com/java/technologies/javase-jdk8-downloads.html
Note: Oracle requires you to create an account before downloading the JDK.
Download & install Apache JMeter
You can find the latest version at: https://jmeter.apache.org/download_jmeter.cgi
Simply download the ZIP file for the binaries, unzip them to the desired directory, and you are good to go!
Configuring load tests
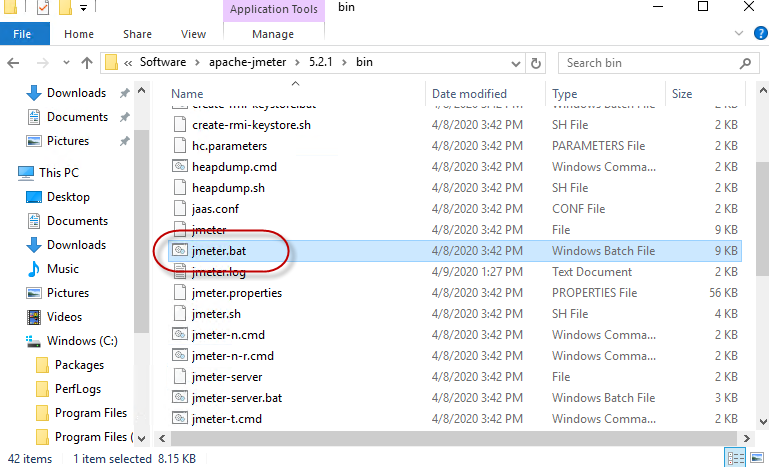
With the VM created and Apache JMeter installed, you can begin configuring your load tests. To do so, you need to launch the JMeter UI. Run jmeter.bat in the JMeter bin folder.
NOTE: It is highly recommended against using the UI when actually running your load tests.
As mentioned earlier, here is a great tutorial on how to configure your load tests in Apache JMeter.
Determining your load test strategy
Your test strategy depends on the questions you need answered.
- Can my website handle Black Friday traffic?
- Can users log into the website if the authentication API is slammed?
- Does converting to async/await actually make a difference?
Another consideration is if there are other metrics you can capture, beyond the top-level performance. For example, can you record and report the duration of a database call, using a Stopwatch? Here, pre-processor directives could be used in conjunction with a “Load Test” build configuration, as could turning Verbose logging on while load tests are running.
Surge testing
While touted as the main use of load testing, one of the trickiest load tests to execute successfully is surge testing. This is not simply hitting the homepage of your website, but executing a series of realistic workflows, and getting a holistic view of how things perform under pressure.
For online stores, you need to reproduce user authentication, then listing products, viewing products, adding to the card, and checking out.
With JMeter, you’ll configure multiple Thread Groups, or virtual user scripts, each performing a series of tasks. You’ll then specify the number of users, each group is allocated, and other details.
Diagnostic testing
Similar to surge testing, you may also need to isolate and test the impact of load on one feature or page, as it relates to another feature or page. Or maybe how sustained load on the API impacts the website.
You could perform these tests with a JMeter load test that has two Thread Groups, or even simply a single Thread Group for load on one feature, with manual testing on the other.
Proof-of-concept testing
If you are familiar with writing unit tests and integration tests, writing code for a POC load test should make a lot of sense.
For example, if you want to test synchronous code to async/await, you could have a simple API with two controllers: one synchronous, and one async/await. Each controller would have methods that do the exact same thing: execute a series of CPU-intensive operations, a set of memory-intensive operations, and a set of network/high-latency operations, like long-running database calls or resource retrievals.
With JMeter, you have a test for each data point (in the example above, CPU/synchronous, CPU/async, Memory/synchronous, etc.), with the same number of thread groups, threads, and duration, and you run each test individually. Once all tests are completed, you have indisputable proof of the advantages of one implementation over another.
Conclusion
The Azure VM created in this article for Apache JMeter will be used as the basis for a series of Real World Impact proof-of-concept tests. The source for each will be on GitHub, at https://github.com/collabroscape/real-world-impact.
Happy testing!
Testing Linux versus Windows
.NET Core on Linux versus Windows
Pingback: .NET Core on Linux vs Windows – Collabroscape